Skip Navigation

Contextual Learning Portal

Wind and Weather

Basics

Units / Activities

  • Talk about weather stations and citizen-scientistsLook at the article from WIRED magazine. Make a list of the items included in a weather station.
  •  

    Web Link: WIRED.com article about DIY weather stations

  • Measuring Wind SpeedMake an anemometer with a motor/generator connected to an Arduino board and computer. Display wind speed readings on the computer. (Uses Snap Circuits(TM) and Snapino (TM) set).
    -------------------

    Make Anenometer from Snapino / Snap Circuits (TM) from MASSConnecting on Vimeo.

    See activity sheet for Arduino code.
  •  /project647_7194/SnapinoMeter.JPG
  • Global wind patternsUse a writeable/erasable globe to draw the major global wind patterns.

    Make small homemade fans to represent wind. Position fans on a paper map of the world.
  • Weather as a Rube Goldberg machineUse drawings, buttons, and other materials to draw an animation about how a storm forms.See activity sheet
  •  

    Web Link: How a Hurricane Forms (VIdeo)

  • Experiment - hot air or hot water rises....Do a demonstration to show that warm air rises. Explain that when warm air rises, a low pressure zone develops. In a colder area, cold air sinks to the ground and creates a high pressure zone. Air will flow from the high pressure zone to the low pressure zone.... that creates a local wind pattern.

    How can you create an experiment that shows that warm air (or water or milk or any substance) will rise. One option is a food color and water experiment. Start with a jar of cold water with blue food coloring; and a jar of hot water with red food coloring. Mix the two; see if the warm water rises to the top.
  • Coreolis EffectWatch video about the Coreolis Effect.
  •  

    Web Link: The Coriolis Effect - YouTube

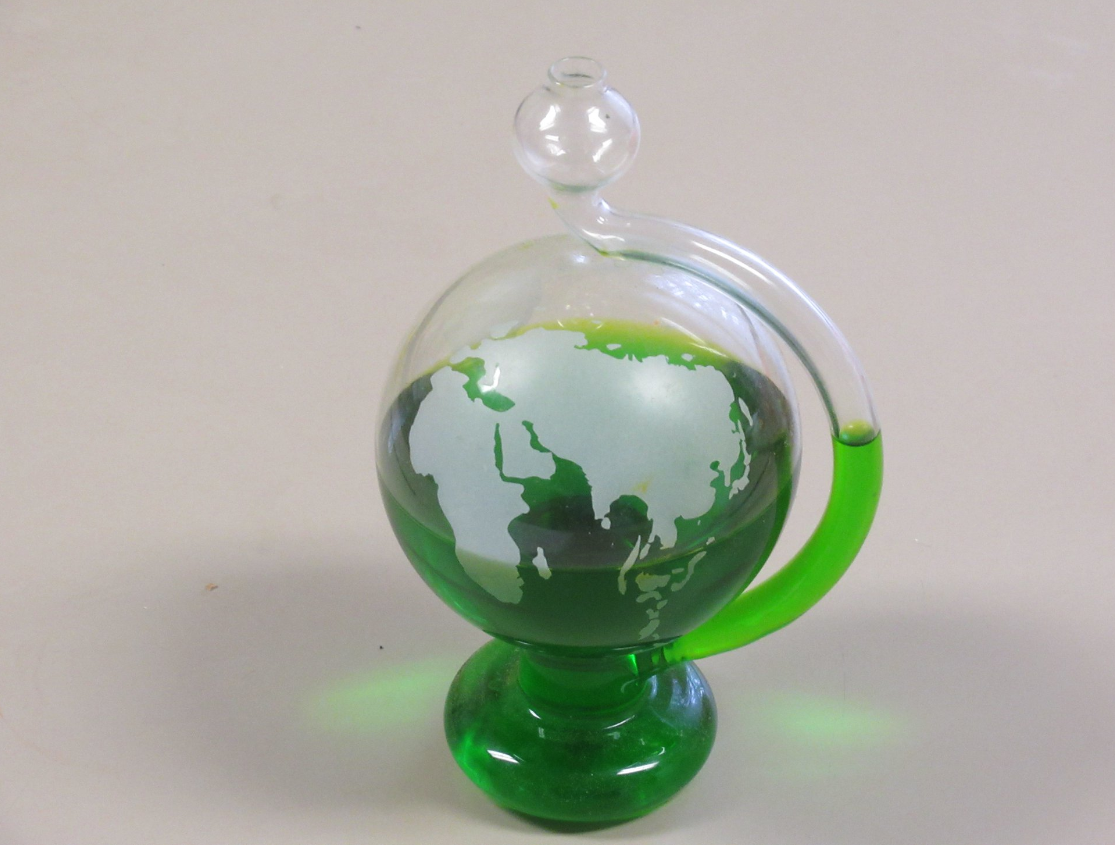
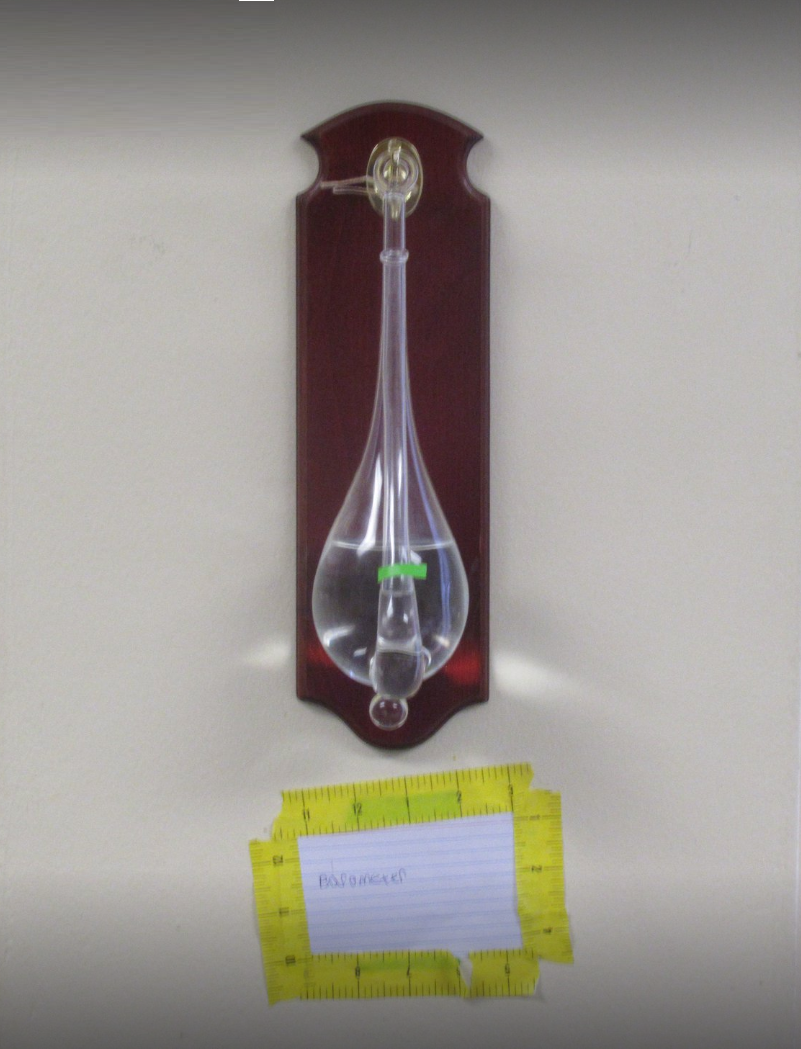
  • Barometers and atmospheric pressureFill a glass-globe barometer with colored water and use it to observe shifts in atmospheric pressure.
  •  /project647_7194/barometer1.png/project647_7194/barometer2.png

Activity Sheets

  • Weather as a Rube Goldberg machine

    Have you ever seen a Rube Goldberg machine?   Or a complex chain of dominoes?  A simple event sets off another event and then another event and another and on and on.  Each event is simple and easy to understand, but the complete chain of events is complex and amazing. 

    Weather patterns can be like that.  Picture a typical storm.  The storm forms and moves because of a series of events.

    1. Somewhere, in a warm climate, the sun warms the air over the ocean or land.  Because of the tilt of the earth, or mountains and valleys in the land, or warm water temperatures in parts of the ocean, or cloud cover. one place might get warmer than other nearby places.

    2. Where the sun has warmed the air, the warm air rises up into the atmosphere.   

    3. Somewhere else, in comparison, the air is colder.  Cold air sinks down toward the earth.  

    4. When warm air rises, the area has low air pressure.

    5. When cold air sinks, the area has high air pressure. 

    6. Air tends to move from areas of high pressure to areas of low pressure., forming wind currents.   

    7. But instead of wind just gently flowing into the low pressure zone, a spiral of wind starts to form.  Why?  The spin of the earth and the global wind patterns create a spiral effect..... the spinning clouds of air and moisture that make up rainstorms and snowstorms.

    8. Now the spinning spiral of air and moisture may begin to move.  Along the Atlantic coast of North America, storms tend to form in the south and travel northeast along the Atlantic coast; from the Caribbean, along the East Coast, travelling north toward New England and Maritime Canada.  

    9. As the storm moves, it may change, from a rainstorm to a snowstorm, or from a snowstorm to a rainstorm; it may intensify into a tropical storm or hurricane, or it may lose strength and become a weaker storm. 

  • ARDUINO (SNAPINO) Code for wind speed measurement

    // Wind Speed - Anenometer
    // NOTES:
    //This is an adaptation of the Light_Monitor Arduino Routine
    // The light monitor measures the input via a photoresistor. 
    // The anenemetor measures the input via a motor/generator that spins when the wind or a fan blows

    // The initial lines define the variables (numbers) that will be used in the program.

    const int myinputsignal = A0;
    int Val = 0;
    int counter=0;
    int RunningAverage=0;
    int Val1=0;
    int Val2=0;
    int Val3=0;

    // The next section sets up the Arduino (Snapino) board

    void setup() {                    

    // This line opens the terminal window.  Remember to click Tools, Serial Monitor (or Serial Plotter) to see results

     Serial.begin(9600);                       //Open terminal window
     pinMode(myinputsignal, INPUT); 
    }

    // The next section is a loop... it repeats until you turn the program off.

    void loop() {


     Val = analogRead(A0);  //Measure the value from the input signal

    // NOTES: The next few lines take the value (Val) and average every three readings.
    // This is called a running average.  This smooths out the readings, in case the signal starts and stops a lot.

     counter=counter+1;
     if (counter==4) {counter=1;}
     if (counter==1) {Val1=Val;}
     if (counter==2) {Val2=Val;}
     if (counter==3) {Val3=Val;}
     RunningAverage=(Val1+Val2+Val3)/3;

     // The next line prints the running average ...
     
     Serial.println(RunningAverage);

     // unlike the light monitor, with the motor/generator, the stronger the signal, the smaller the value
     // if there is no signal, the value is 1023.
     // So we subtract the reading from 1023 to create a scale that has higher values for more wind/speed.
     
     Serial.print(1023-RunningAverage);

     // The next lines use IF statements to print the words 'no wind', 'light winds', or 'strong winds' depending the value.
     
      if (RunningAverage<950)
      { Serial.println(" strong winds");
      }
      else
      if (RunningAverage <1023)
      { Serial.println(" light winds");
      }
      else
      { Serial.println (" (no wind)");
     
    }
    // The next line instructs the program to wait 500 milliseconds before taking the next reading.

     delay(500);
    }


Tags = Science-Wednesdays | science | weather | Arduino/Snapino | Subject = Science | Grade Level = Elem, MS | Time Period = | Program/Funding = |
Direct website link to this project: http://ContextualLearningPortal.org/contextual.asp?projectnumber=647.7194